Concepts beautifully visualized brick by brick.
  • HOME
  • RISK
    • RISK APPETITE
    • MARKET RISK
    • FRTB REGULATION
  • FINANCE
    • CAPITAL MARKETS
  • TECHNOLOGY
    • FINTECH
    • SERVICE DELIVERY
  • TWEETS
  • MUSINGS
  • ABOUT ME
Picture

fundamental review of the trading book

FRTB (BCBS 352) is a major regulation that impacts the Market Risk Reporting

FRTB - Fundamental Review of the Trading Book 

FRTB has a major impact on the way MARKET RISK is calculated and reported. 
Picture

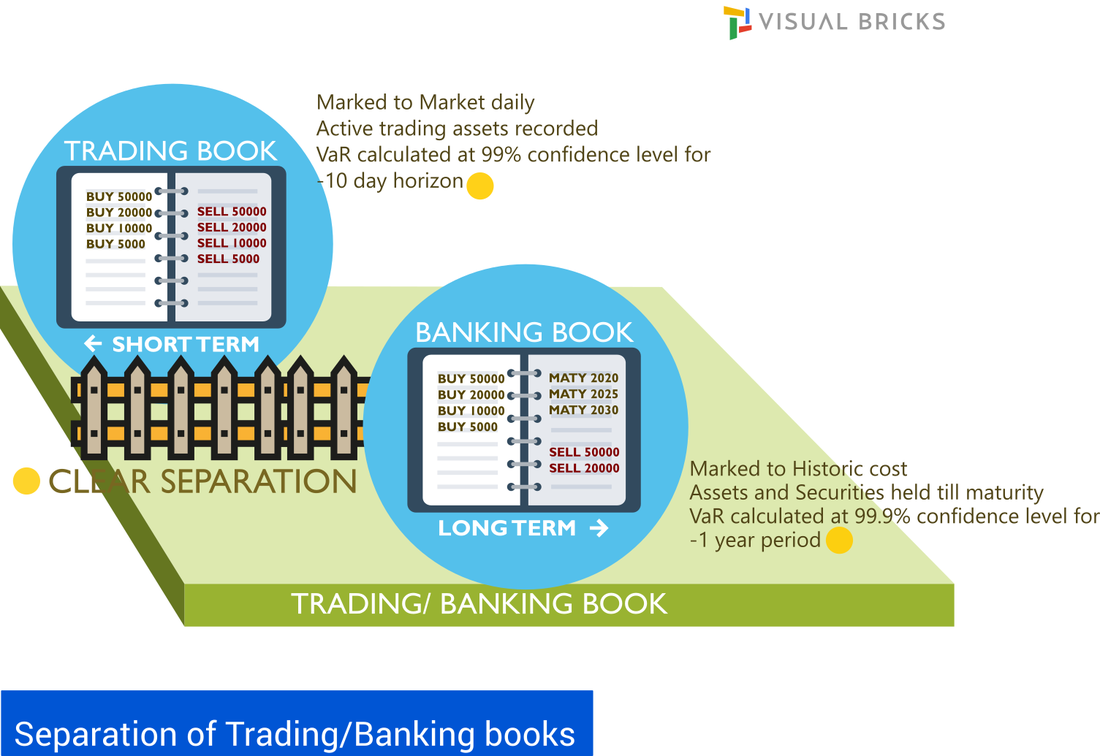
​A key requirement of FRTB is the clear separation of the Trading and Banking Books. Trading books contain information and buying/selling history about all the securities currently held by the bank. All types of investment activity meant for trading is included in the trading books. Options, Futures, Currency, Commodity books are examples of different kind of books maintained by the banks. Trading book provides useful information for future trading activity and management of risk. Trading book is marked to market daily and value at risk for assets is measured on a ten day horizon under Basel II at 99% confidence level.

Banking book refers to assets on banks balance-sheet that are expected to be held till maturity. Assets in the banking book are held at historic cost. The value at risk Is measured at a 99.9% confidence level on a one year horizon. Banks would hold assets in trading book to incur lower risk charge.
Additionally, the new banking book / trading book boundary and its limited permeability in terms of internal risk transfers may put entire trading strategies and business lines at risk due to higher capital costs.

FRTB Trading and Banking Book
Picture

​Structure and working of Trading desk 
A Trading desk must be approved by supervisors. It must have a Head Trader and each trader must be assigned to only one Trading Desk. It must have a clear organization with reporting to senior management, must outline business strategy,  authorized instruments and products for trading, trading/hedging strategies, clearly defined trading limits reviewed annually, customers and counterparties,  risk management structure, risk limits and allocation, management reports covering cost, revenue and clearly defined compensation policy lined up to the desk  objectives.
Trading desks have to do weekly P&L reporting and internal and regulatory risk measure reports (including desk VaR / ES, desk VaR / ES sensitivities to risk factors and backtesting) to be eligible for internal modelling.

The regulation touches the following areas starting from the trading floor. A high level view of the trading floor, desk structure and key functions of the traders is illustrated below.

Fundamental Review of the Trading Book - Desk structure
Picture

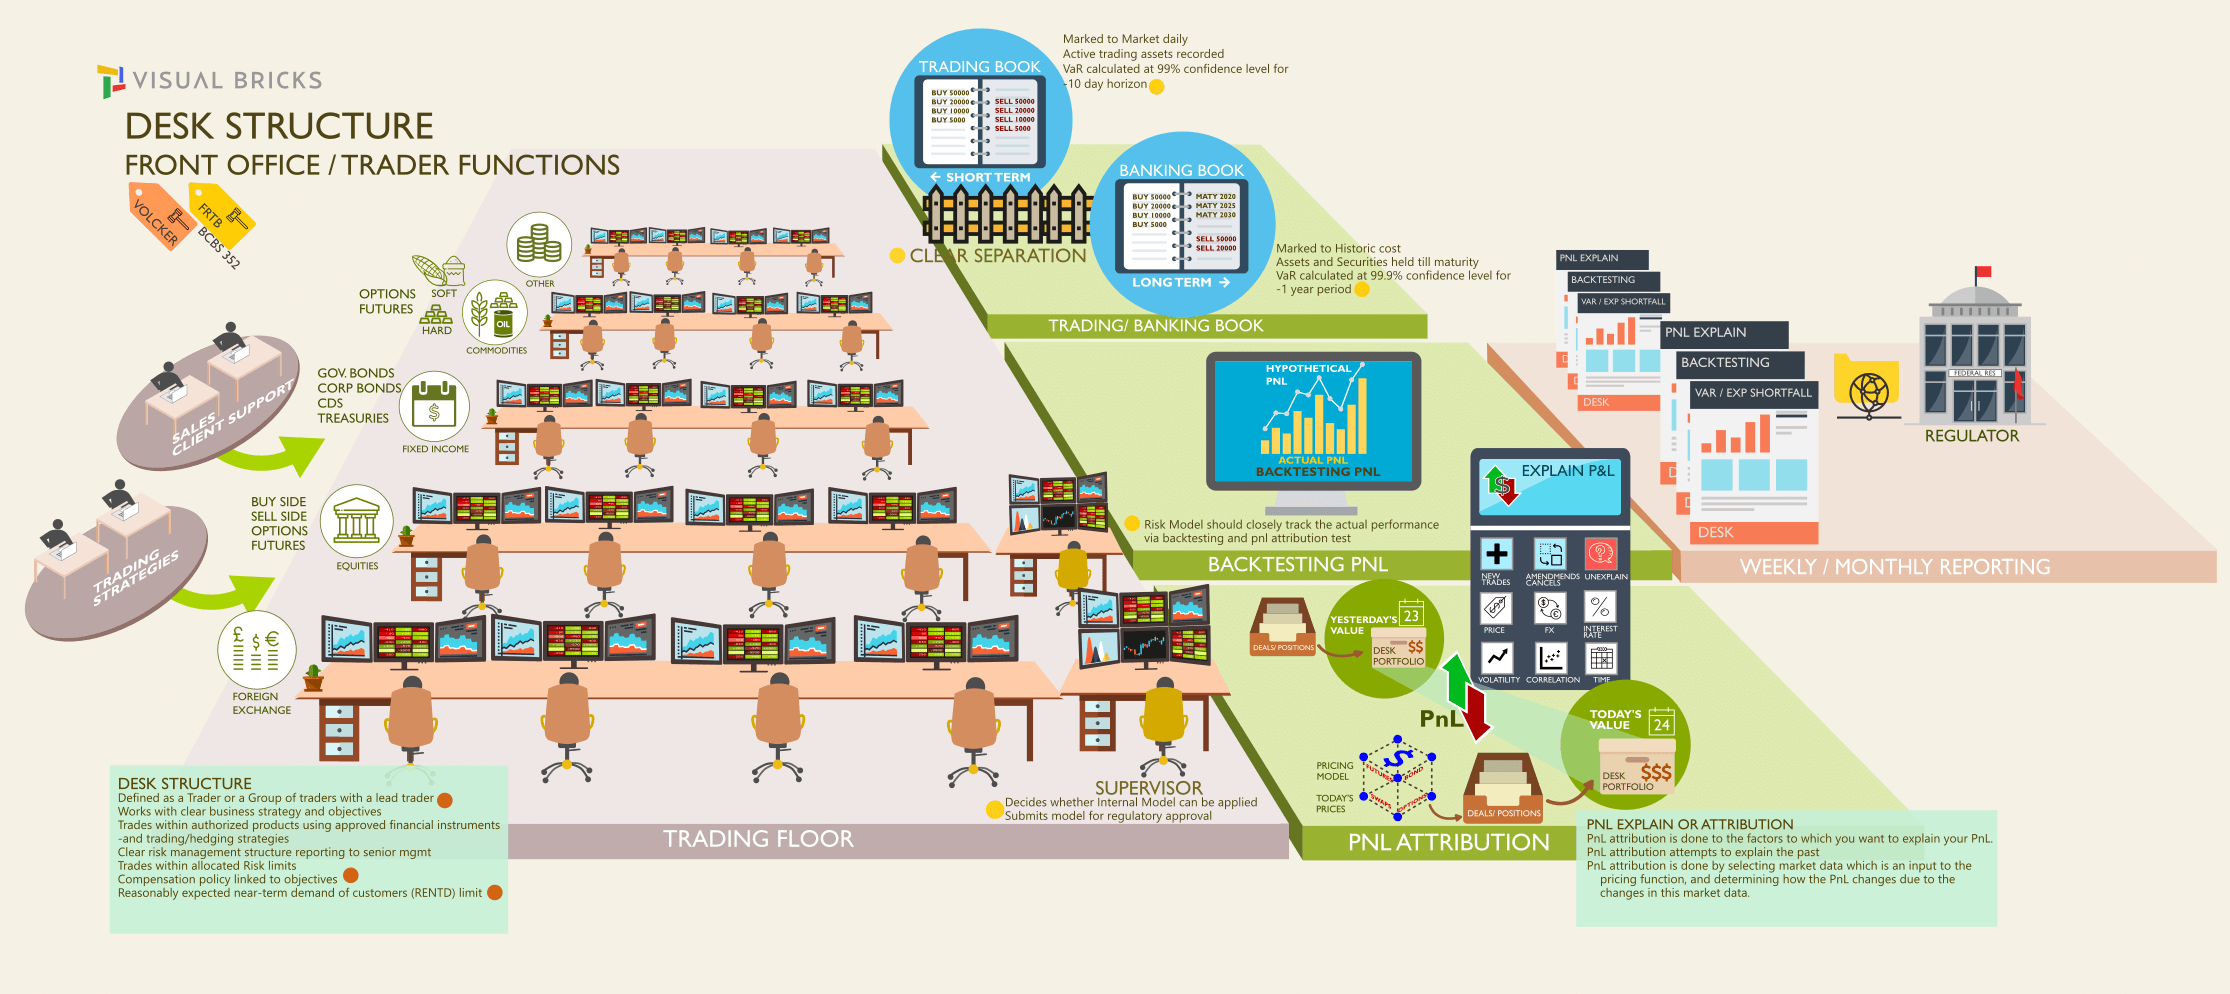
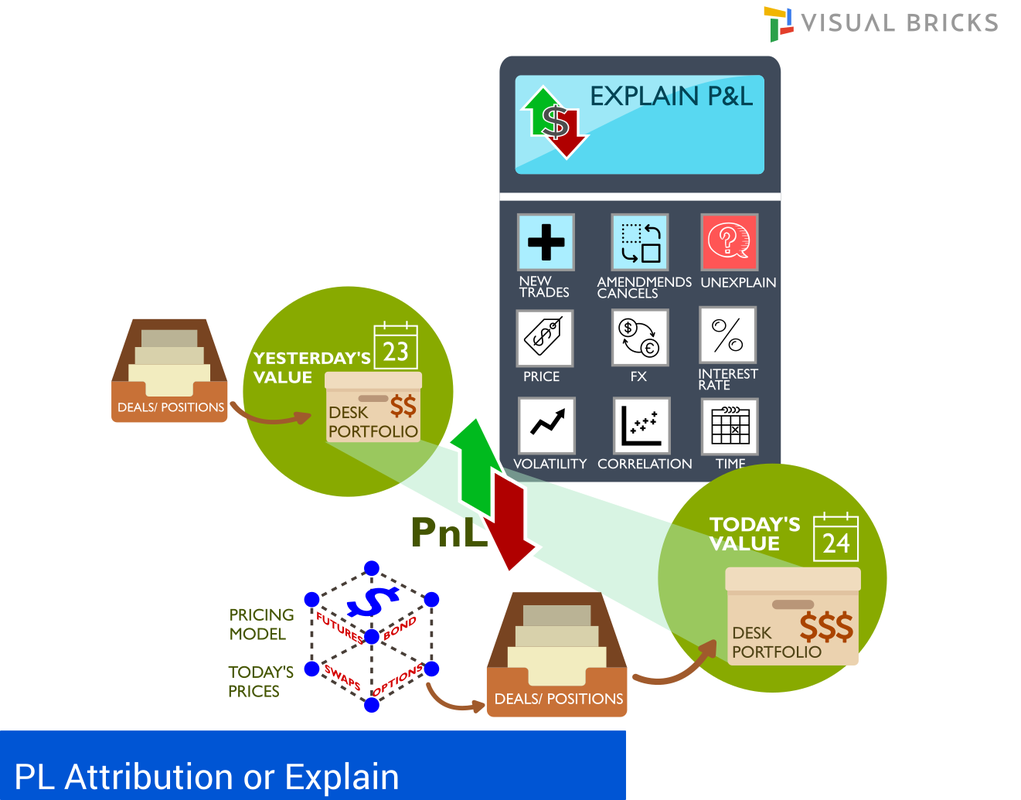
​PnL attribution

PnL = Value of portfolio as of today - Value of Portfolio as of yesterday.
​PnL attribution gives you that information on what generated that PnL. It is done to factors. 100% of PnL is explained to the factors, whatever remains unattributed is assigned to "Unexplained". Sensitivities are computed to the factors which is used to predict the PnL.

P&L attribution reporting is based on two metrics and is reported prior to end of every month:
  1. Mean unexplained daily P&L (ie risktheoretical P&L - hypothetical P&L) /standard deviation of hypothetical daily P&L. Value outside the range of -10% to +10% is a breach.
  2. Variances of unexplained daily P&L / hypothetical daily P&L.  Value above 20% is considered a breach.
If the desk experiences four or more breaches within the prior 12 months then it must be capitalised under the standardised approach. 
​


P&L Attribution - FRTB
Picture

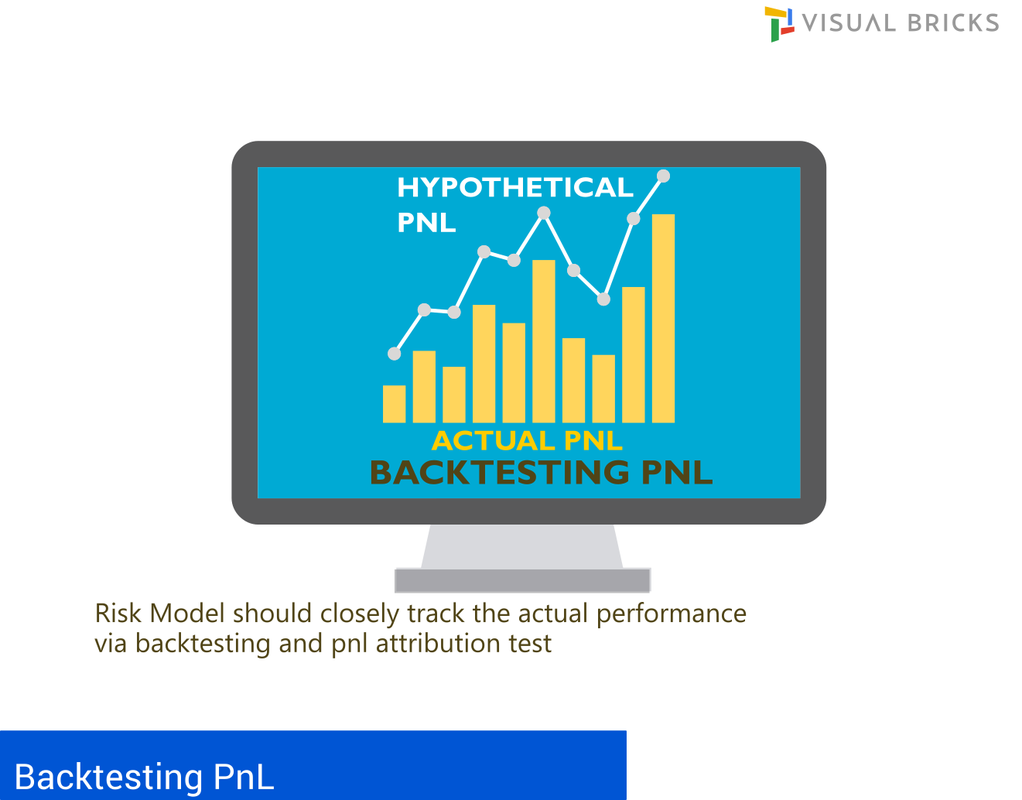
​Backtesting
 
Actual pnl is compared to the hypothetical pnl calculated using the front office pricing models which contains more risk factors and is more precise. ​Risk models should closely track the actual performance vis backtesting and the PnL attribution test.
​Risk theoretical pnl for a desk is based on the firms risk management models and are not based on front office pricing models.

​Backtesting requires comparing each desk’s 1-day static var at both the 97.5th percentile and the 99th percentile, using at least one year of current observations of the desk’s one-day P&L. If any given desk experiences either more than 12 exceptions at the 99th percentile or 30 exceptions at the 97.5th percentile in the most recent 12-month period, all of its positions must be capitalised using the standardised approach until the desk no longer exceeds the above thresholds over the prior 12 months. 

Backtesting P&L FRTB

Picture

The revised Standardised approach (SA) fundamentally overhauls the calculation of a risk charge to make the banks sufficiently risk-sensitive while still providing an  appropriate standard for banks that do not require a sophisticated treatment for market risk. Risk charge is the amount of capital that a bank should hold as a consequence of the risks it takes.

The capital charge under Standardized approach =
    Capital Risk charges for Delta,Vega and curvature under sensitivities based method  +
    Default risk charge  +
    Residual risk add-on

on prescribed Risk classes.

Risk charge  calculated on each risk class =  Delta Risk measure + Vega Risk measure + Curvature Risk measure.
  Delta is  a risk measure based on sensitivities of a bank’s trading book to regulatory delta risk factors.
  Vega is a risk measure that is also based on sensitivities to regulatory vega risk factors.
  Curvature is a risk measure which captures the incremental risk not captured by the delta risk of price changes in the value of an option.  Curvature risk is based on two stress scenarios involving an upward shock and a downward shock to a given risk factor. The worst loss of the two scenarios is the risk position to be used as an input into the aggregation formula which delivers the capital charge. 
Vega and curvature measures are only calculated for instruments subject to optionality.
Three risk charges must be calculated for each risk class based on three different scenarios as the correlations (correlation between risk factors within a bucket) and (correlation across buckets within a risk class) may increase or decrease in periods of financial stress.

Risk Charge calculation is an aggregation of risk positions first at the bucket level, and then across buckets within a risk class. The calculation of Risk charges must used the same pricing model used in actual profit and loss reporting. 

The seven risk classes are:
General interest rate risk, 
Credit spread risk: non-securitisation, 
Credit spread risk: securitisations (non-correlation trading portfolio),
Credit spread risk: securitisations (correlation trading portfolio),
Equity risk,
Commodity risk and
Foreign Exchange risk
2. Risk factors are mapped to a risk class.  Risk factors are variables (eg a given vertex of a given interest rate curve or an equity price). Risk factors are mapped to a risk class.
3. Net Sensitivities (delta,vega, curvature) are calculated to risk factors. The net sensitivities for each risk factor within a risk class is multiplied by a respective risk weight. Risk charge is calculated for each bucket, as well as across buckets, for each risk class under the delta and vega risk framework.
4. Positions are bucketed by common characteristics into risk buckets within each of the risk classes. Examples of risk buckets - Currency, Currency pair, Market   Cap, Sector, Credit Quality buckets, etc. Risk positions are fed into the risk charge computation. For delta and vega risks, it is a sensitivity to a risk factor. For curvature risk, it is the worst loss of two stress scenarios.
5. Applicable risk weights are applied to net sensitivities.These weighted sensitivities are then aggregated using correlations. 
6. Correlations between risk factors within a bucket and across buckets within a risk class are applied.
7. Risk charges are aggregated after application of risk weights and correlations.

Two stress scenarios are to be computed per risk factor (an upward shock and a downward shock) with the delta effect, already captured by the delta risk charge, being removed. The two scenarios are shocked by risk weights and the worst loss is aggregated by correlations.

The Default risk charge captures the jump-to-default risk for non-securitisations, securitisations (non-correlation trading portfolio) and securitisation correlation trading portfolio. 
Finally a residual risk add-on is used to capture all market risks that can be captured in the standardised approach.
​
Banks must calculate the standardised capital charge for each trading desk which will be used as fallback capital charge for those desks that fail the eligibility under internal model approach.

Fundamental Review of the Trading Book - Standardized Approach
Fundamental Review of the Trading Book - Standardized Approach Risk Buckets and Risk Classes
Picture
Internal Model Approach
Only approved trading desks by the supervisory authorities are allowed to use the internal model approach for the determination of regulatory capital.  Securitisation exposures in the trading book are fully out of scope of internal models. Approvals are provided based on  the soundness of the banks risk management system, accuracy of measuring risk, track record of conducting stress tests and the skills of using sophistical models in the risk control, audit and back office areas. Independent risk control unit is responsible for the design and implementation, must conduct regular backtesting and profit and loss (P&L) attributions at a trading desk level. The daily reports and stress testing reports (on a monthly basis) must be reviewed by senior management and must be able to enforce reduction of positions, overall risk exposure or increasing capital.
​

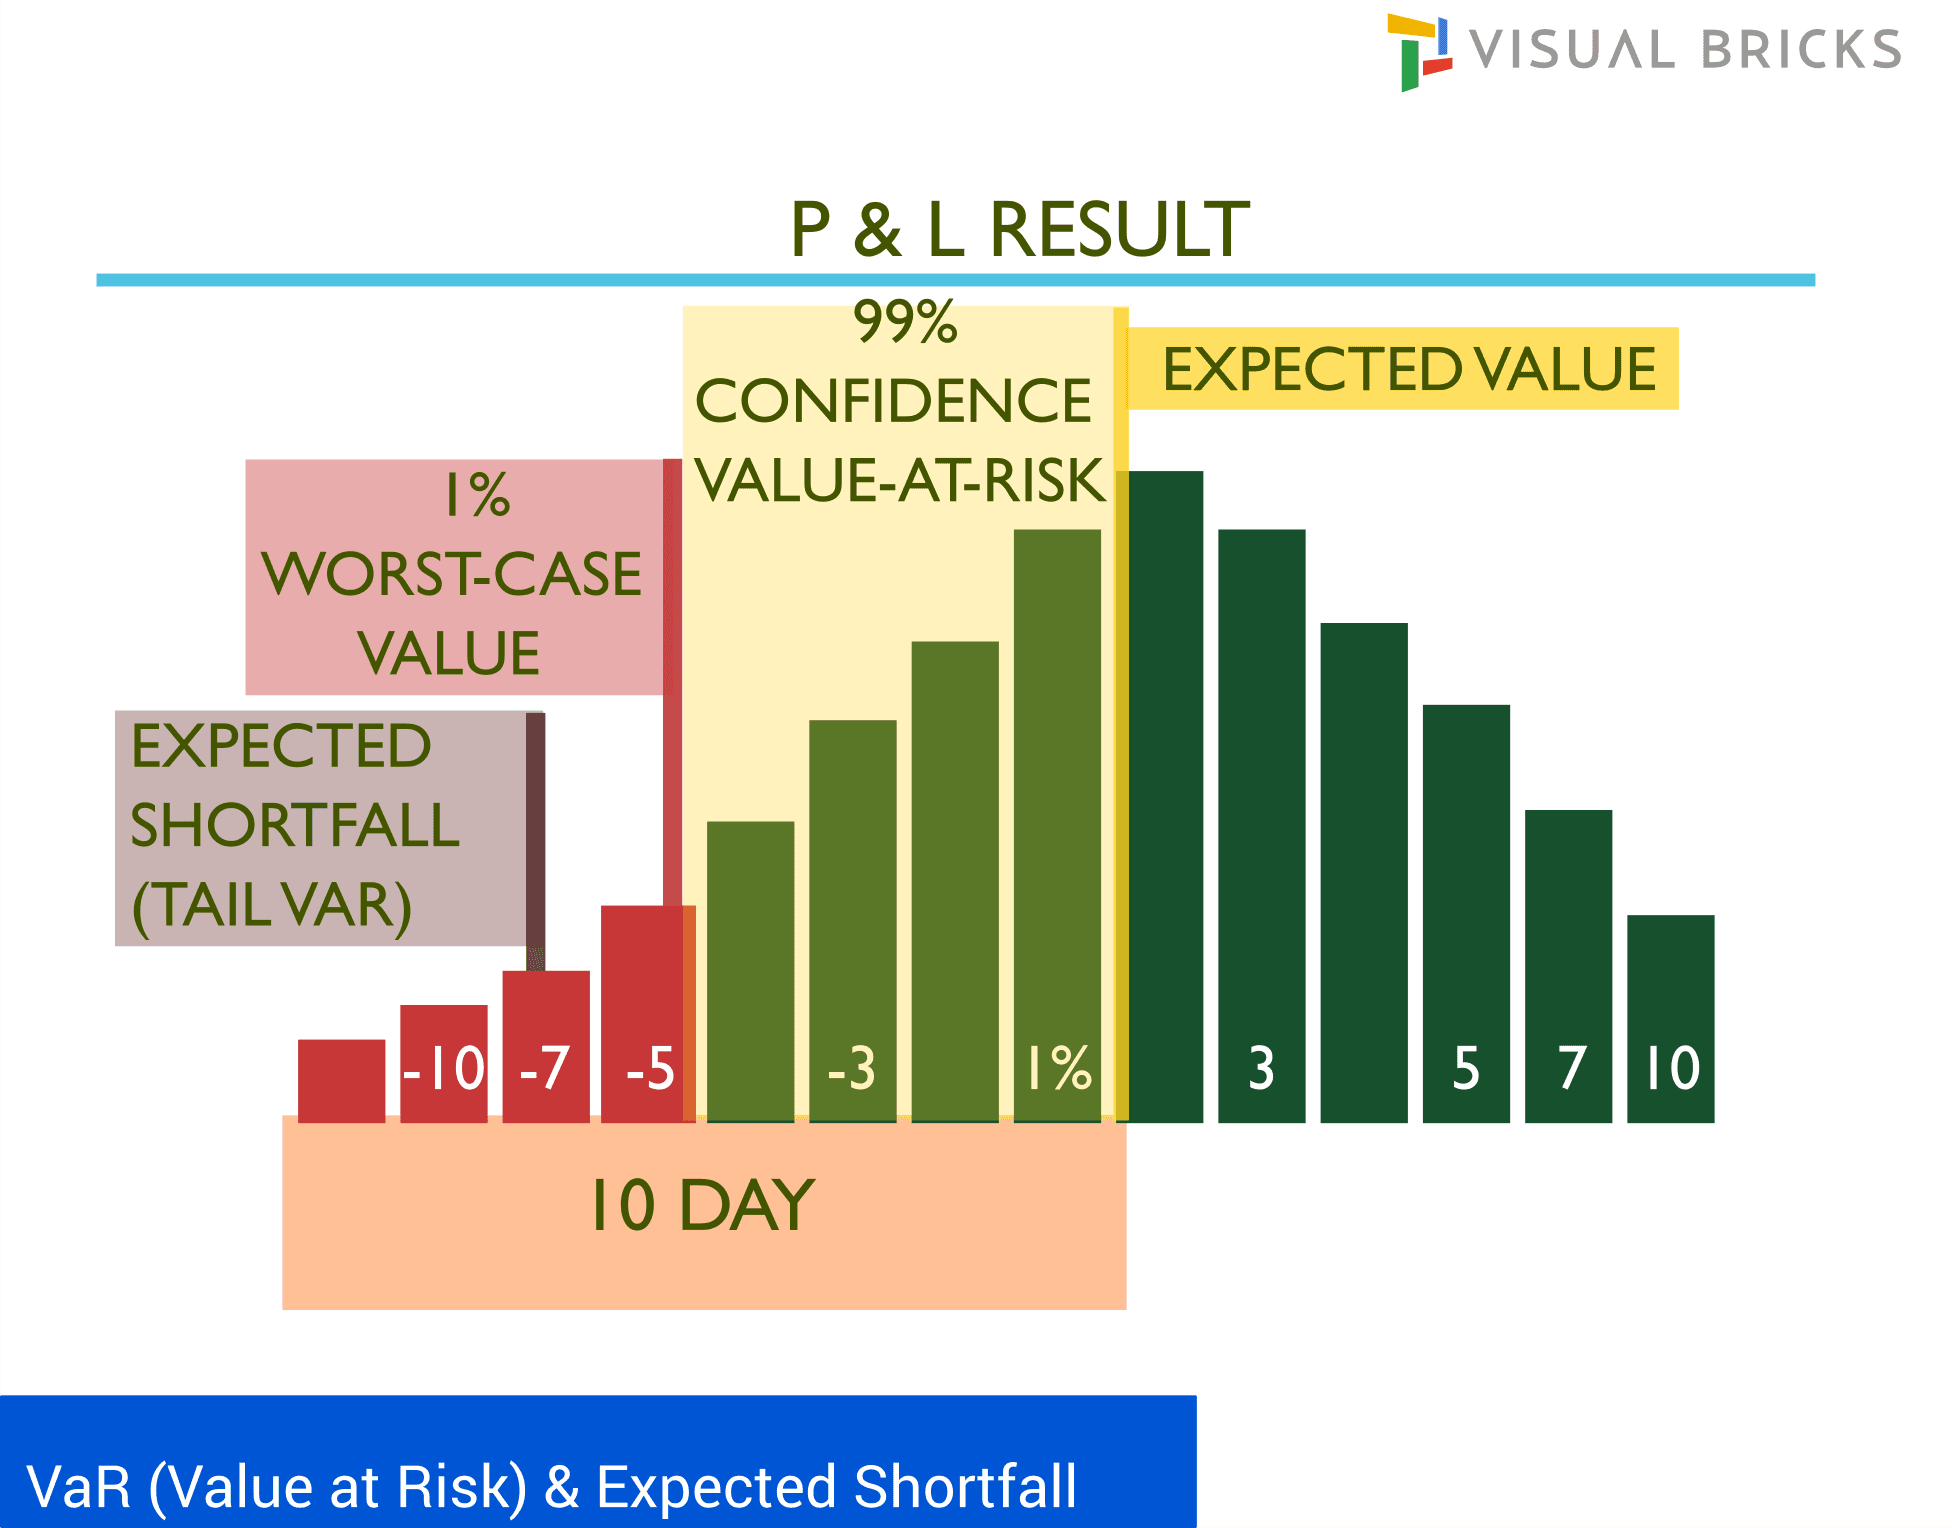
Expected shortfall must be computed on a daily basis at a 97.5th percentile confidence level for each trading desk included in the scope for the internal model. The calculation must be calculated for a base liquidity horizon of 10 days and scaled to 20,40,60 and 120 days liquidity horizon. The horizons are based on risk factor categories. The ES must be calibrated to a the most severe 12-month period of stress over the observation horizon in which the portfolio experienced the largest loss using relevant risk factors.
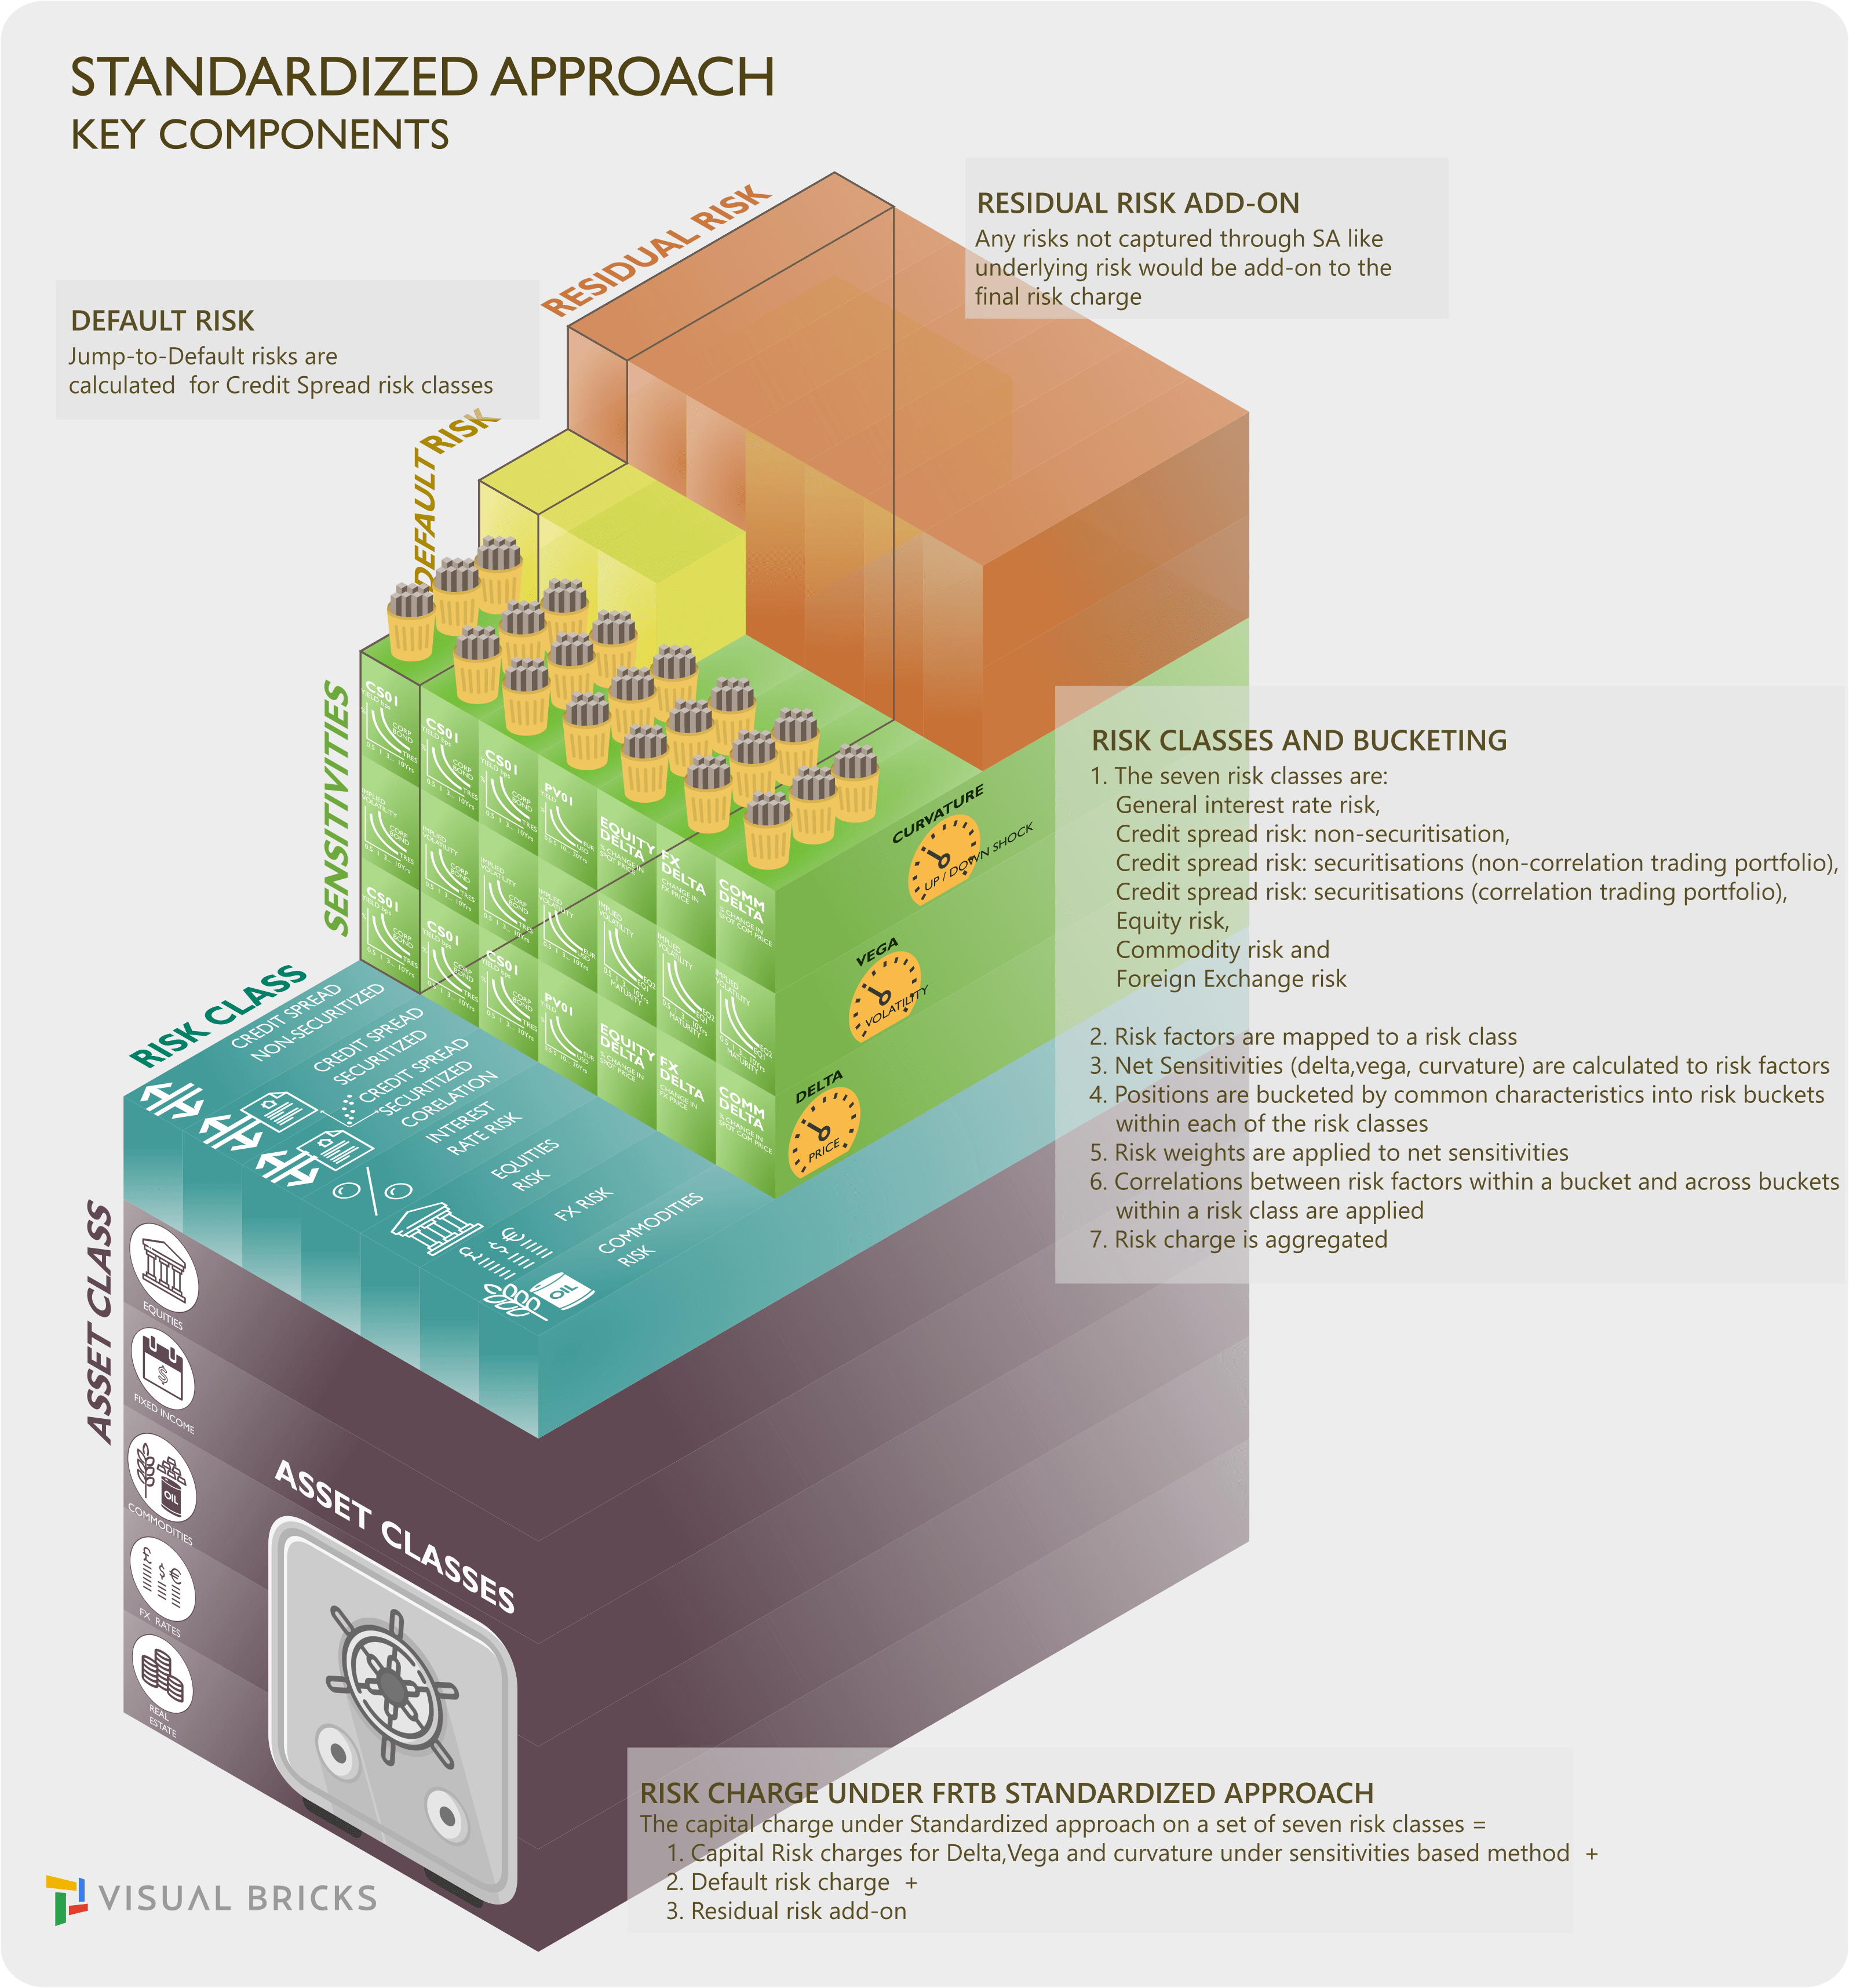
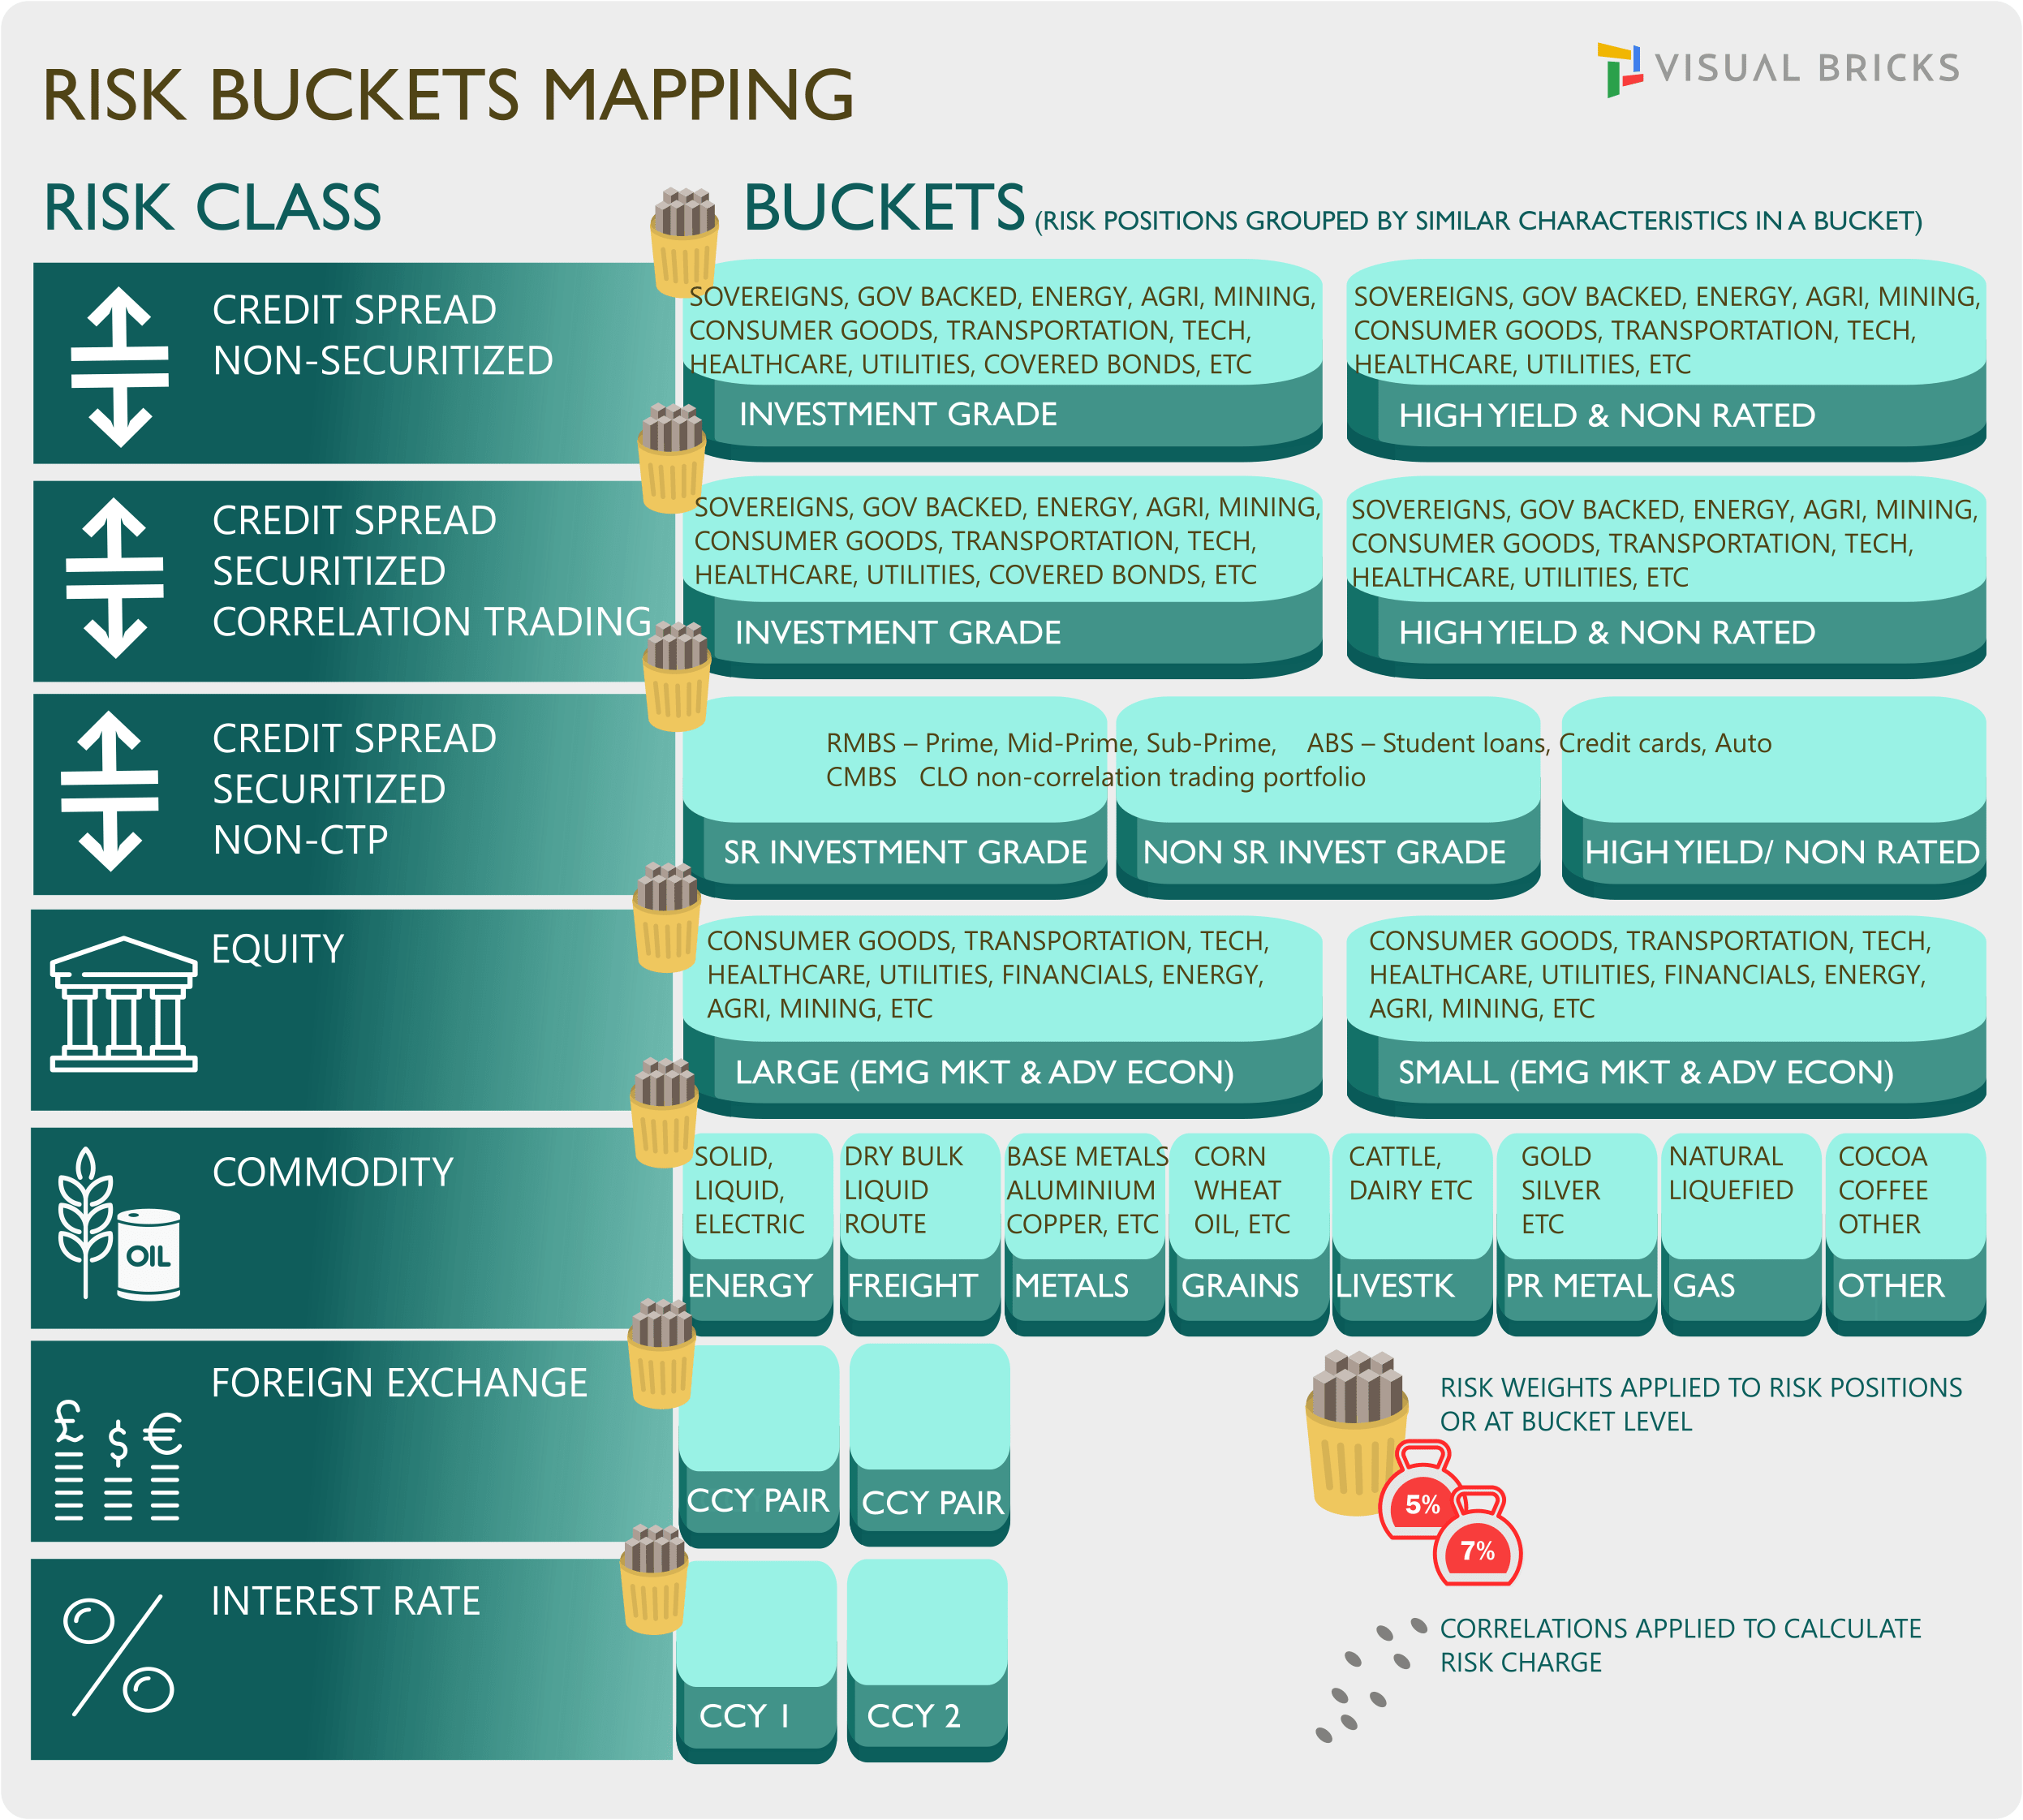
Models must be periodically revalidated for any structural changes in market or the composition of the portfolio.
If the desk experiences four or more breaches within the prior 12 months then it must be capitalised under the standardised approach.
Banks must calculate the standardised capital charge for each trading desk which will be used as fallback capital charge for those desks that fail the eligibility under internal model approach.

Fundamental Review of the Trading Book - Expected Shortfall and VaR
Default Risk under IMA
Default risk is the risk of direct loss due to a counterparty default and any potential indirect losses that may arise from a default event. A separate internal VaR model is required to measure the default risk. The model must use two types of systematic risk factors. Default risk must be measured for each counterparty. Due to the unique relationship between credit spread and default risk, banks must seek approval for each desk with exposure to these risks, both for credit spread risk and default risk. A bank must assume constant positions over the one-year horizon, or 60 days in the context of designated equity sub-portfolios.

Stress Testing
A rigorous and comprehensive stress testing program at both the trading desk and bankwide level is required for banks that use the internal models approach for meeting market risk capital requirements.
The stress scenarios need to cover a range of factors that can create extraordinary losses or gains in trading portfolios. These factors include low-probability events in all major types of risk, including the various components of market, credit, and operational risks. Banks should subject their portfolios to a series of simulated stress scenarios and provide supervisory authorities with the results. A second type of scenario would evaluate the sensitivity of the bank’s market risk exposure to changes in the assumptions about volatilities and correlations. 
© COPYRIGHT 2018. ALL RIGHTS RESERVED.
  • HOME
  • RISK
    • RISK APPETITE
    • MARKET RISK
    • FRTB REGULATION
  • FINANCE
    • CAPITAL MARKETS
  • TECHNOLOGY
    • FINTECH
    • SERVICE DELIVERY
  • TWEETS
  • MUSINGS
  • ABOUT ME