market risk
Market risk refers to the risk of losses in the bank's portfolio due to changes in the financial markets.

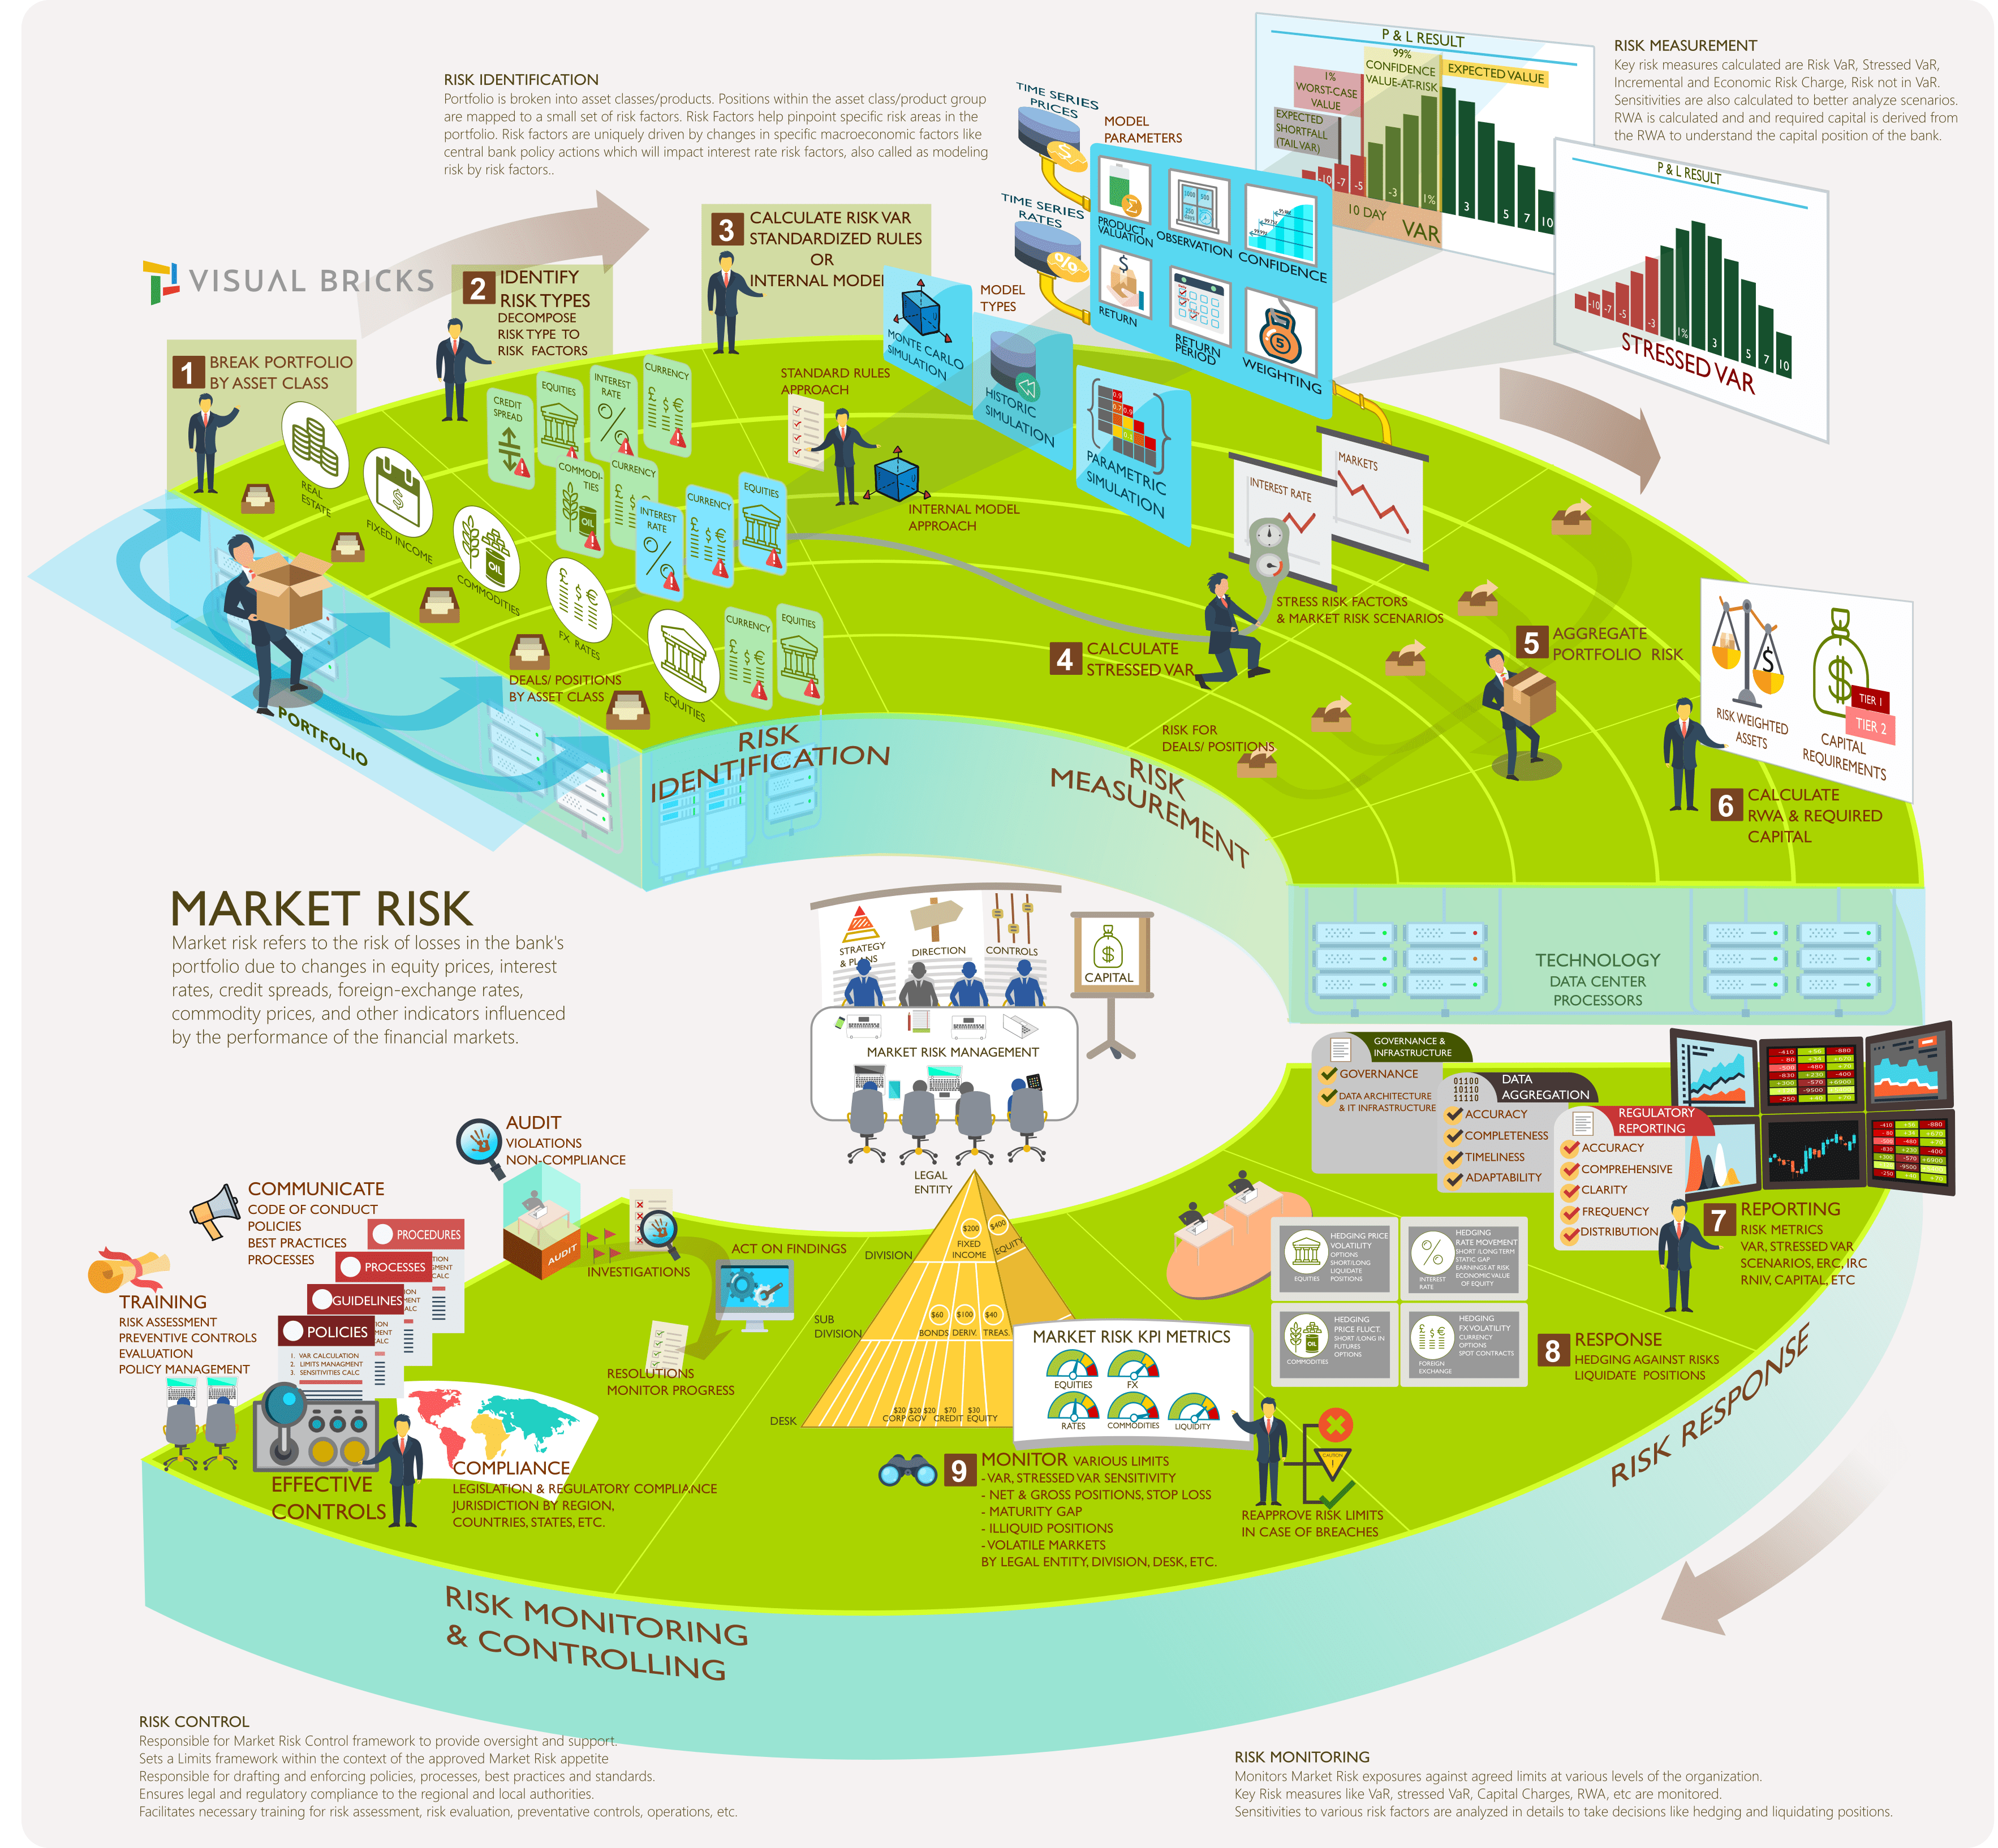

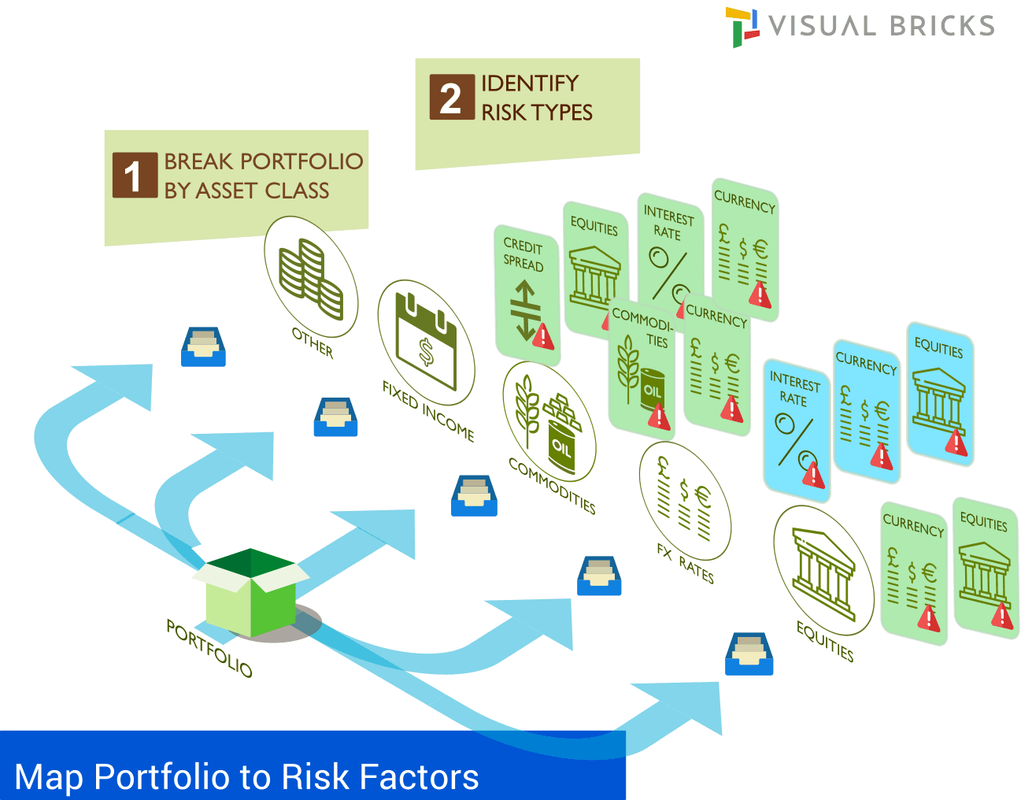
Risk Identification
Identify and map positions to the Risk Factors Risk identification begins with identifying risk factors in the portfolio as a first step. Positions are mapped to a small set of risk factors which is called as risk factor mapping. It depends on the number and type of instruments within the portfolio. Risk Factors help pinpoint specific risk areas in the portfolio. Risk factors are uniquely driven by changes in specific macroeconomic factors like central bank policy actions which will impact interest rate risk factors. This is also called as modeling risk by risk factors. Large number of deals are mapped to a smaller set of risk factors reducing the computing time for risk simulations. As an example in the illustration, Interest Rate, Currency and Equites risk factors are mapped for all the rates positions. If a portfolio contains 1000 Rates deals all of them can be mapped to the above 3 risk factors. Comparable assets can also be used as proxy assets for modeling in cases where enough historical data is not available for positions or some OTC instrument that has no previous history. |
|

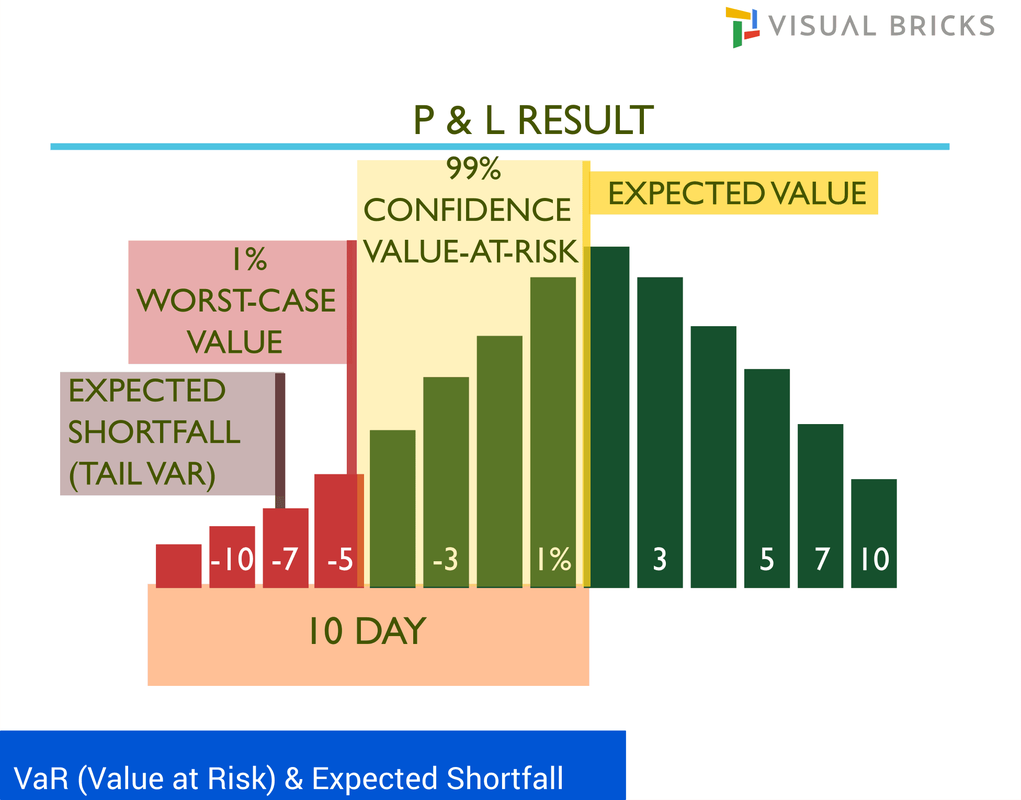
Risk Measurement
The key risk measures that are calculated for the Market Risk are: VaR, Stressed VaR, IRC, RC and RNIV. VaR (Value at Risk) is used for the day to day risk management, setting risk limits, decision making to guide investment and hedging strategies, and for reporting including annual disclosures. VaR is the default model used for the calculation of minimum capital requirements and is set at a high confidence level of 99% or higher to protect against crisis events that would threaten the survival of the bank. VaR is derived from the distribution of P&L, and is the loss quantile of the distribution. VaR is the minimum loss given the probability. It is one single number that represents the risk. It is an estimate of loss over a fixed time period that would be equal or exceed with a given probability.as an example if a portfolio has 10-day VaR of 1m with a confidence level of 99% then there is a probability of 1% that the portfolio may lose 1m or more over next 10 days. It provides a common consistent way to measure risk across positions and risk factors. |
|
|
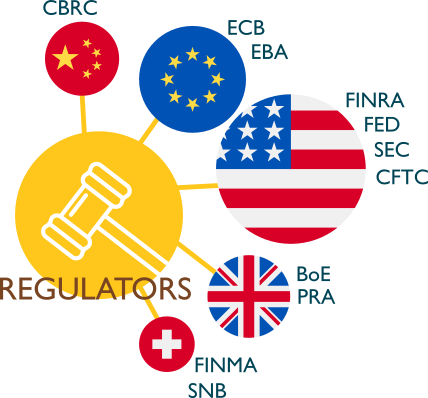
Calculating Risk Measures
Calculation of VaR is driven by country specific regulatory requirements, it can also be driven by region and product specific regulators. A segment can have its own regulator depending on the size of the market. USA has multiple regulators governing the different kind of markets while some countries can have a regulator overlooking everything. |
|
|
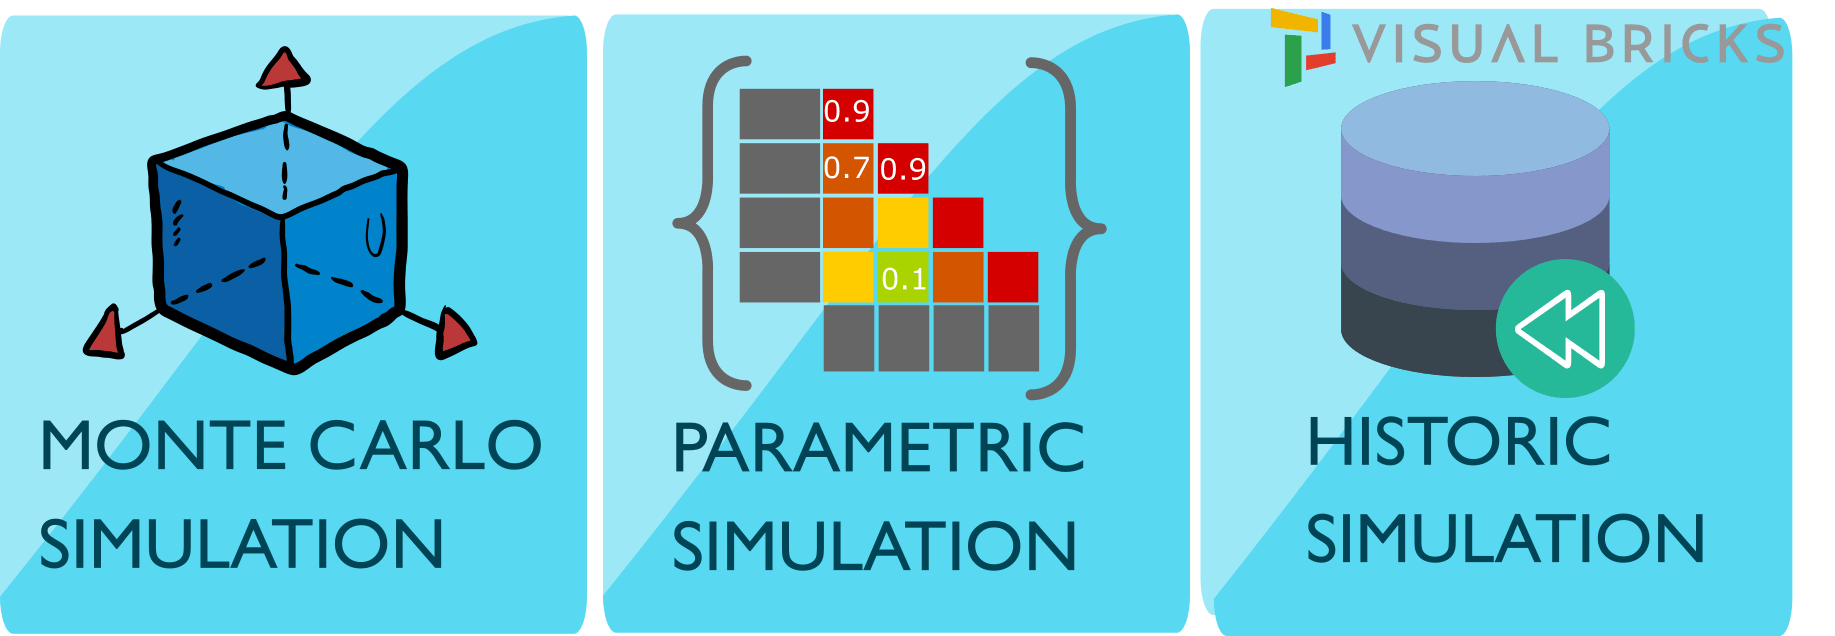
Calculation methodologies
Historic Simulation, Variance Co-Variance/parametric and Monte-Carlo simulation are commonly used methodologies to produce VaR numbers. In the Historical simulation approach, the distribution is made of scenarios sampled from history. Marginal VaR describes change in total var resulting from 1 dollar change of the component value (positions of different instruments) Incremental VaR is a change in VaR due to new position added to a portfolio. Component VaR is often used by risk management as it is additive i.e the component VaRs add up to the portfolio VaR. |
|
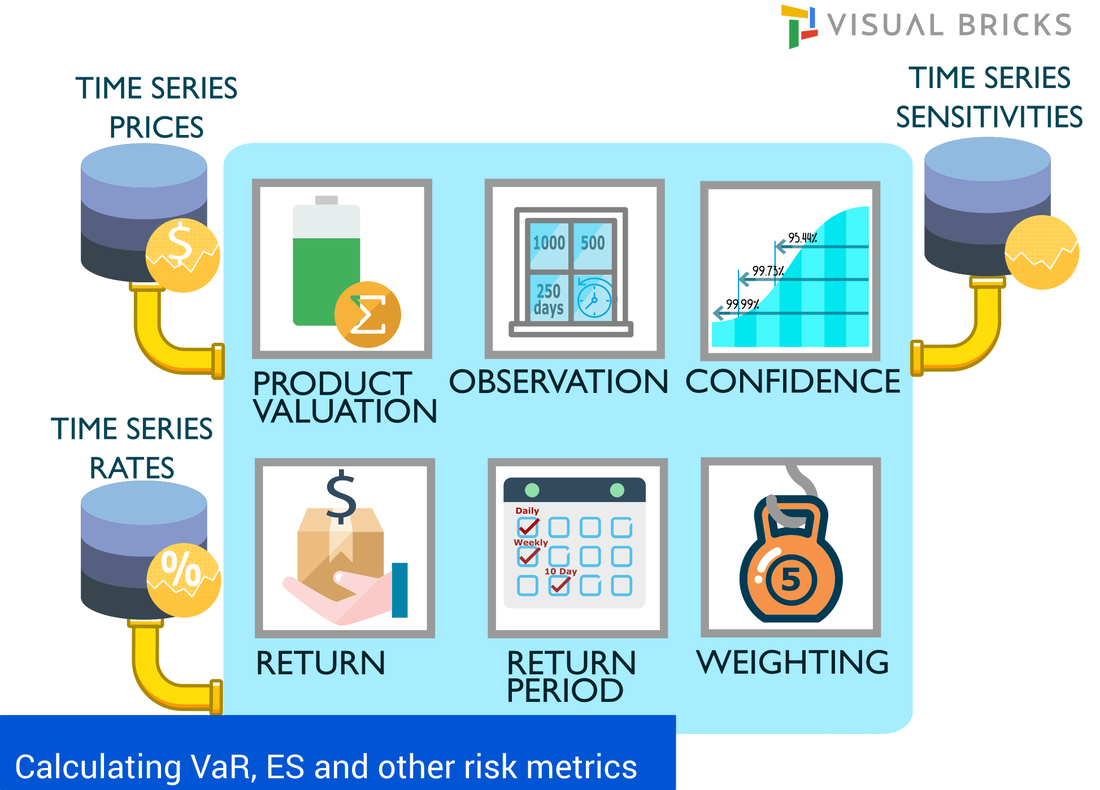
Var Calculation Inputs
|
|
|
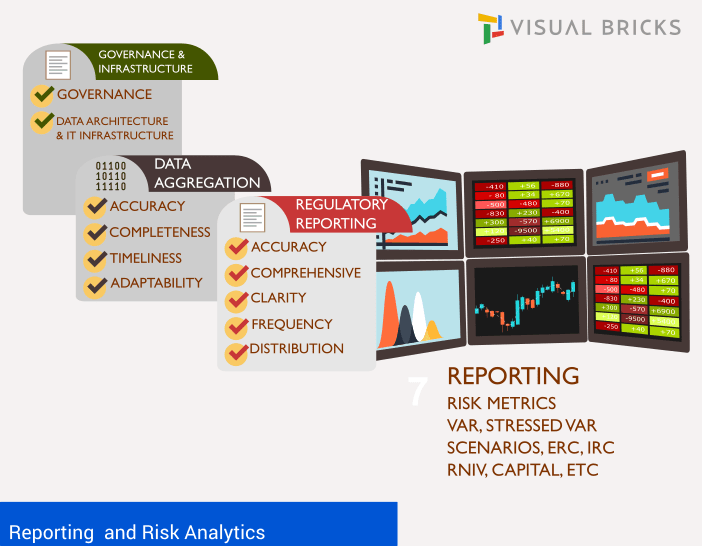
Reporting and Analytics
The reporting and analytics systems must be comprehensive covering: - Overarching Governance structure, supervisory workflows - Risk Data Aggregation across Organization levels, Regions and Lines of Business - Provide granularity across spectrum of the organization from leadership to management to support - Report on all key Risk Indicators, highlight areas of concern and emerging threats and opportunities - Provide analytical tools to monitor changes and transparency to lowest levels of data - Compliance to the Legal and Regulatory requirements The IT infrastructure must be scalable to support these capabilities. It must adhere to the principles for effective risk data aggregation and risk reporting by Basel Committee on Banking Supervision. -Governance & IT infrastructure -Accuracy and Integrity, Completeness, Timeliness and Adaptability - Comprehensiveness, Clarity and usefulness, Frequency and Distribution Refer to BCBS 239 principles here: www.bis.org/publ/bcbs239.pdf |

Monitoring Risk
Banks monitor various types of limits to reduce the risk exposure. Limits are authorized by the board and the senior risk management committees. They are allocated across the organization by risk types, business lines from top to bottom, regions, legal entities and countries. The risk organization reports and monitors the compliance against the approved limits. The types of limits used are:
|

|
|

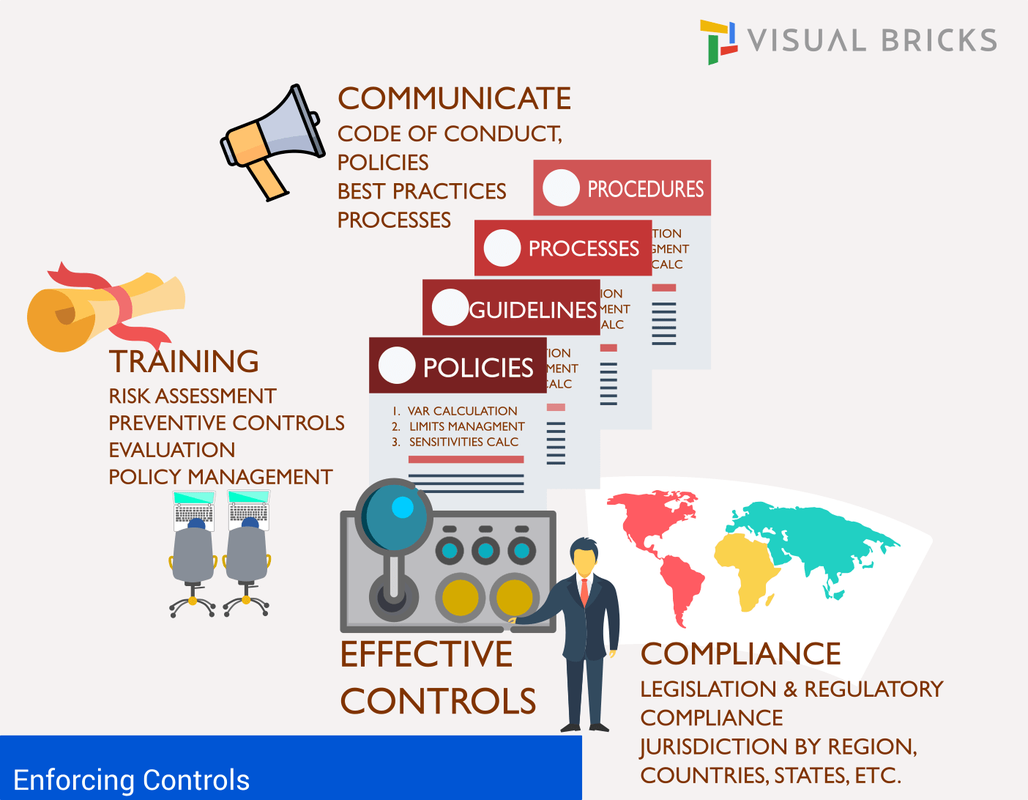
Effective Controls and Compliance
The compliance team is responsible for the Market Risk Control framework to provide oversight and support. It sets Limits framework within the context of the approved Market Risk appetite. It is also responsible for drafting and enforcing policies, processes, best practices and standards. The unit ensures legal and regulatory compliance to the regional and local authorities. Necessary training for risk assessment, risk evaluation, preventative controls, operations, etc. are facilitated by this team. |